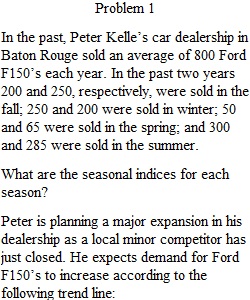


Q Forecasting Homework Problem 1 In the past, Peter Kelle’s car dealership in Baton Rouge sold an average of 800 Ford F150’s each year. In the past two years 200 and 250, respectively, were sold in the fall; 250 and 200 were sold in winter; 50 and 65 were sold in the spring; and 300 and 285 were sold in the summer. 1. What are the seasonal indices for each season? 2. Peter is planning a major expansion in his dealership as a local minor competitor has just closed. He expects demand for Ford F150’s to increase according to the following trend line: Demand = 800 + 50T where T is the number of years from today (i.e. this year is year zero, next year is year one) Using the above seasonal indices and trend line, predict Peter’s sales during fall, winter, spring, and summer 8 years from now. Problem 2 Below is three months of data on total sales from McDonalds in Huntsville. Using the data below, please answer the following question. Month Sales August $30,000 September $45,000 October $55,000 Assuming an initial forecast in August of $25,000, an initial trend component of 0, ? = 0.6 and ? = 0.6, make a forecast for October’s sales using both the regular exponential smoothing forecast AND the trend adjusted exponential smoothing forecast (in the case of the trend adjusted exponential smoothing forecast, please provide the final forecast, known as FITt). Which forecast makes a better prediction for October’s sales? Why do you think this forecast makes a better prediction in October?
View Related Questions